1.1 The cashew industry has a long history, dating back to the tropical regions of the Americas, especially the north-east of Brazil. The Tupi people, who were the original inhabitants of that land, knew how to cultivate and consume the cashew called acajú. The cashew trees were part of the Columbian exchange, a process of biological and cultural transfer that occurred after the European exploration of the Americas. The Portuguese and Spanish explorers carried the cashew trees to Asia and Africa around 1500 AD, where they became an important crop. The cashew was recorded by the French, Portuguese and Dutch sailors in the 16th century, who were impressed by its taste. Andre Thevet illustrated cashew in his book Les singularitez de la France Antarctique in 1557, which was one of the first accounts of cashew. In Africa it was first introduced in the east coast in Mozambique and from there it spread to the West Coast. In India, cashew was first introduced in the Malabar Coast by the Portuguese in the 16th century for preventing soil erosion, as per report in the book “The Agronomy & Economy of Important Tree Crops of the Developing World”. From there it spread to other parts of the country as well as to Southeast Asia. The tree adapted well to the climate of Asia and Africa, where it spread naturally and became a common sight in family gardens and wild forests. India was the first to develop the modern cashew processing industry and had a strong position in the global market for a long time.
1.2 The relative position of countries changed significantly during the last five decades. For instance, the countries like Benin and Cote d’Ivoire only began large scale cashew production in the 1990s, but have since recorded higher growth rates. Mozambique was the world’s largest cashew producer in the early 1960s, but production declined significantly in the early 1970s. The United Republic of Tanzania experienced a similar decline in cashew output throughout the 1970s and 1980s but has seen a revival since 2010. Vietnam did not grow cashew on a significant scale before the 1980s, when the Government began to promote the development of the cashew sector. Production in India has followed a path of steady growth since the early 1960s. However, of late, its position started deteriorating as a result of the growing competition from other Countries. Cashew is now grown mainly in Africa, Asia and South America. Africa is the world’s leading producer of Raw Cashew Nut (RCN), accounting for more than half of the global output. The continent has a favorable climate and soil for cashew cultivation. African countries such as Cote d’Ivoire, Tanzania, Burundi, Mozambique, Benin, Guinea- Bissau, Burkina Faso and Ghana are major suppliers of RCN. A growing number of these nations are also foraying in to cashew processing. Asian producers, include India, Cambodia, Vietnam and Indonesia.
1.3 Tree nuts include Almonds, Walnuts, Cashews, Pistachios, Hazelnuts, Pecans, Macadamias, Pine Nuts and Brazil Nuts. A remarkable growth of 60.74% has been observed in the global production of tree nuts in the last ten years, reaching 53.75 lakh MT of kernels in 2022-23 from 33.44 lakh MT in 2013 - 14. Cashew kernels, which contributed 18 % of the total kernel output with 6.02 lakh MT in 2013-14, increased its share to 20 % with 10.95 lakh MT in 2022-23. Figure 1.1 displays the quantity of cashew output and world’s tree nut output from 2013-14 to 2022-23.
Figure 1.1: Global Production of Tree Nuts and Cashew Nuts (Quantity in Lakh MT on Kernel basis)
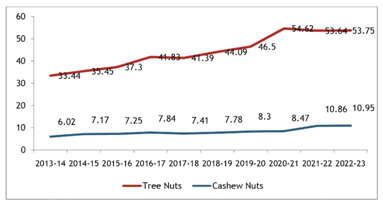
Source: Statistical Yearbook 2022-23, INC
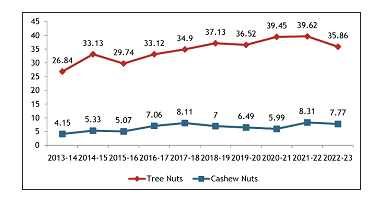
1.4 The value of tree nuts produced globally increased from 26.84 Bn USD in 2013-14 to 35.86 Bn USD in 2022-23, an increase of 33.61 per cent. Cashew contributed significantly to this growth, as its share increased from 15.46 per cent in 2013-14 to 21.67 per cent in 2022-23. Figure 1.2 shows the trend of cashew supply value from 2013-14 to 2022-23.
Figure 1.2: Global Supply Value of Tree Nuts and Cashew Nuts (Value in Billion USD)
1.5 Among the tree nuts, almonds topped the list in global consumption with 15.71 lakh MT, followed by Walnuts with 9.77 lakh MT and Cashews with 9.65 lakh MT. Figure 1.3 presents the consumption pattern of tree nuts in 2021-22.
Figure 1.3: Share of Different Tree Nuts in Global Consumption of Tree Nuts during 2021-22
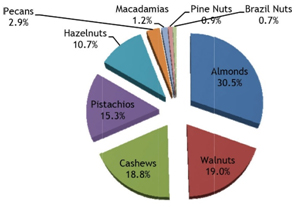
Source: Nuts & Dried Fruits Statistical Yearbook 2022-23, INC
1.6 Asia ranks first in tree nut consumption, followed by Europe, North America and Middle East. The region wise consumption of tree nut is illustrated in Figure 1.4.
Figure 1.4: Region wise Consumption Pattern of Tree Nuts during 2021-22
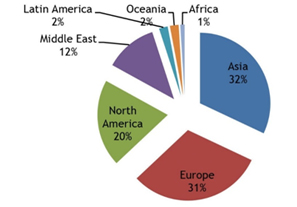
Source: Nuts & Dried Fruit Statistical Yearbook 2022-23, INC
1.7 The global production of RCN ranged from 2.90 to 5.63 lakh MT in the 1960s and 1970s, it started to increase in the 1980s and 1990s, reaching 12.18 lakh MT in 1995-96. The production of RCN accelerated in the 2000s and 2010s, reaching 37.06 lakh MT in 2017-18. The production of RCN declined slightly in 2018-19 to 34.84 lakh MT, but recovered in 2019-20 and 2020 - 21 to 36.76 and 41.46 lakh MT respectively. The production of RCN has increased to 50.00 lakh MT in 2022-23. The global production of RCN from 1960-61 to 2022-23 is presented in Figure 1.5.
Figure 1.5: Global Production of Raw Cashew Nuts (RCN) (Quantity in Lakh MT)
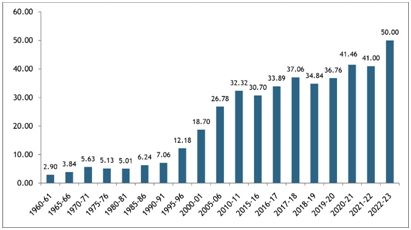
Source: Statistical database of Food and Agriculture Organization (FAO) & Statistical Yearbooks published by International Nut & Dried Fruit Council (INC).
1.8 The global production of RCN in the year 2020-21 was dominated by six countries: Cote d’Ivoire (20.5%), India (17.8%), Vietnam (8.4%), Burundi (7.3%) Philippines (6.2%) and Tanzania (5.6%). These countries collectively produced nearly two-thirds of the total RCN output in the world. The productivity of RCN, measured as the yield per hectare, varied significantly among countries. The productivity levels were very high in Philippines, Peru, Mali, Mexico, Sri Lanka and Malaysia, each produced more than 2000 kg of RCN per hectare. Among them, only Philippines and Mali produced a significant volume. The data on the area, production and productivity of RCN in various countries during the year 2020-21 is presented in Table 1.1.
Table 1.1: Global Production of Raw Cashew Nuts (RCN) during 2020-21
| Sl. No. | Country | Area (Ha) | Production (MT) | Productivity (kg/Ha) |
| 1 | Cote d'Ivoire | 2033886 | 848700 | 417 |
| 2 | India | 1158532 | 738009 | 684 |
| 3 | Vietnam | 280886 | 348504 | 1241 |
| 4 | Burundi | 277597 | 300910 | 1084 |
| 5 | Philippines | 29669 | 255915 | 8626 |
| 6 | United Republic of Tanzania | 816225 | 232681 | 285 |
| 7 | Benin | 524250 | 190000 | 362 |
| 8 | Mali | 40583 | 173207 | 4268 |
| 9 | Burkina Faso | 148636 | 162105 | 1091 |
| 10 | Guinea-Bissau | 291365 | 160630 | 551 |
| 11 | Brazil | 426131 | 139921 | 328 |
| 12 | Indonesia | 526022 | 131872 | 251 |
| 13 | Mozambique | 154858 | 128225 | 828 |
| 14 | Nigeria | 142553 | 98809 | 693 |
| 15 | Ghana | 155572 | 82420 | 530 |
| 16 | Sri Lanka | 15621 | 33655 | 2155 |
| 17 | Thailand | 15415 | 24320 | 1578 |
| 18 | Guinea | 11780 | 20856 | 1771 |
| 19 | Malaysia | 7607 | 16148 | 2123 |
| 20 | Kenya | 22690 | 12668 | 558 |
| 21 | Senegal | 21209 | 8750 | 413 |
| 22 | Togo | 5477 | 8111 | 1481 |
| 23 | Madagascar | 15329 | 7199 | 470 |
| 24 | Colombia | 2379 | 4443 | 1868 |
| 25 | Mexico | 1576 | 4077 | 2587 |
| 26 | Peru | 609 | 3670 | 6026 |
| 27 | Gambia | 1685 | 2767 | 1642 |
| 28 | Honduras | 1444 | 2094 | 1450 |
| 29 | Angola | 2656 | 2033 | 765 |
| 30 | Myanmar | 1711 | 1482 | 866 |
| 31 | El Salvador | 1517 | 936 | 617 |
| 32 | Dominican Republic | 9391 | 658 | 70 |
| 33 | China,mainland | 204 | 230 | 1128 |
| Total | 7145065 | 4146005 | 580 |
Source: CEPCI
1.9 Global cashew kernel production has increased significantly in the past decade reaching 10.95 lakh MT in 2022-23 from 6.02 lakh MT in 2013-14. India ranked second with 1.62 lakh MT (14.8%), followed by Cambodia with 1.54 lakh MT (14.1%) and Vietnam with 1.04 lakh MT (9.5%). Brazil and Indonesia contributed 3% and 2% of the global production respectively.
1.10 The global supply value of cashew kernels has increased by 87.23 per cent to 7.77 billion USD in 2022-23 from 4.15 billion USD in 2013-14. This is greater than that of other major tree nuts such as almonds, pistachios, walnuts, and hazelnuts.
1.11 The global cashew kernel exports shows a steady increase from 2011-12 to 2021-22 with only one year (2018-19) showing a slight decline. The export volume showed an overall growth of 6.48 % per annum. The highest export volume was recorded in 2021- 22, with 7.05 lakh MT. Figure 1.6 presents the volume of export of cashew kernels from 2011-12 to 2021-22.
Figure 1.6: Global Export of Cashew Kernels (Qty. in Lakh MT)
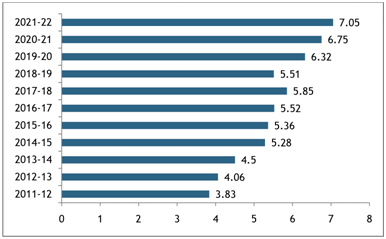
Source: Nuts & Dried Fruits Statistical Yearbook 2022-23, INC
1.12 During the year 2021-22, Vietnam was the leading exporter of cashew kernels with nearly two-thirds (65%) of the total volume. Its main customers were USA, European Union, United Kingdom and China. India remains as the second largest exporter of cashew kernel, with just 10 per cent share of the global exports. India’s major export destinations are Asia (UAE, Japan and Saudi Arabia), European Union and the United Kingdom. Netherlands is in the third position with a share of 6 per cent. The other major exporters include Germany, UAE, Brazil and Cote d’Ivoire, each with less than 5% of the total volume. However, Netherlands, Germany and UAE are only transit countries. The major exporters of cashew kernels during 2021-22 are shown in Figure 1.7.
Figure 1.7: Major Exporters of Cashew Kernels during 2021-22 (Qty. in Lakh MT)
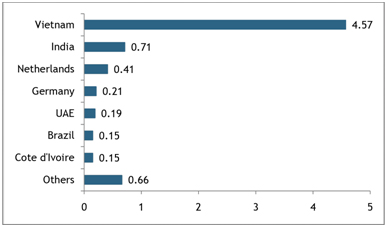
Source: Nuts & Dried Fruits Statistical Yearbook 2022-23, INC Note: Netherlands, Germany and UAE are transit countries.
1.13 In 2021-22, USA imported the highest quantity of cashew kernels in the world, with 1.86 lakh MT. This was 0.71 lakh MT more than in 2011-12. Germany and Netherlands followed as the second and third largest importers of cashew kernels. China and UAE were the two major import destinations that reduced their cashew kernel imports since 2011-12. Figure 1.8 shows the
Figure 1.8 Country wise Import of Cashew Kernels (Qty. in Lakh MT)
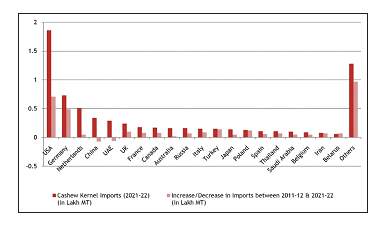
Source :Nuts & Dried Fruits Statistical Yearbook 2022-23, INC global cashew kernel imports in 2021-22 and the changes from 2011-12.
1.14 The global consumption of cashew kernels has increased significantly in the past five years (Refer Table 1.2). The total consumption rose from 6,49,250 metric tons (MT) in 2017-18 to 7,92,892 MT in 2021-22, an increase of 22.10 per cent. However, the consumption patterns varied across countries, with some showing a remarkable growth and others experiencing a decline.
1.15 India, the largest consumer of cashew kernels in the world, witnessed the most notable increase in consumption. Indian consumption grew from 247,598 MT in 2017-18 to 322,160 MT in 2021-22, an increase of 30.1% over the five year period indicating the increasing popularity of cashew among the Indian consumers.
1.16 The second largest consumer of cashew kernels, the USA, also showed a significant growth in consumption, from 1,50,263 MT in 2017-18 to 1,82,814 MT in 2021-22. The factors that influence the consumption patterns include the availability and price of cashew kernels, competition from other nuts and dry fruits, changing consumer preferences, the trade relations and policies, and the socio-economic and environmental conditions.
Table 1.2: Global Consumption of Cashew Kernels (2017-18 & 2021-22)
| Sl. No. | Countries | 2017-18 (Consumption in MT) | 2021-22 (Consumption in MT) |
| 1 | India | 247598 | 322160 |
| 2 | USA | 150263 | 182814 |
| 3 | Germany | 56949 | 53621 |
| 4 | China | 48357 | 35063 |
| 5 | UK | 19891 | 22589 |
| 6 | France | 12772 | 17321 |
| 7 | Canada | 4579 | 16022 |
| 8 | Australia | 15068 | 15855 |
| 9 | Russia | 7023 | 15623 |
| 10 | Italy | 6459 | 13905 |
| 11 | Japan | 10245 | 13813 |
| 12 | Poland | 6164 | 12813 |
| 13 | Turkey | 4027 | 11552 |
| 14 | Belgium | 6537 | 10744 |
| 15 | Saudi Arabia | 8175 | 9869 |
| 16 | Spain | 5656 | 9720 |
| 17 | Thailand | 7593 | 8747 |
| 18 | Iran | 10833 | 7391 |
| 19 | Brazil | 16914 | 7097 |
| 20 | Israel | 4147 | 6173 |
| Total | 649250 | 792892 |
Source: Nuts & Dried Fruits StatisticalYearbook2022-23, INC
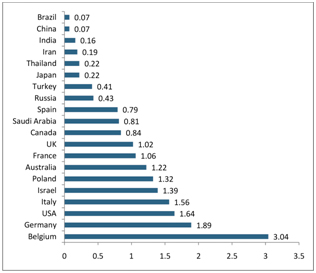
1.17 The per capita consumption of cashew kernels is highest in Belgium, followed by Germany, USA, Italy and Israel during 2021-22. The estimated per capita annual consumption of India, as per INC data, is only 0.16 kg in 2021-22. It may be noted that nine countries have the per capita consumption above one kg per annum. The estimated per capita consumption (kg/year) of cashew kernels during 2021-22 is shown in Figure 1.9.
Figure 1.9: Country wise Per Capita Consumption of Cashew Kernels in 2021 (Qty. in Kg/Year)
Source: Nuts & Dried Fruits Statistical Yearbook 2022-23, INC
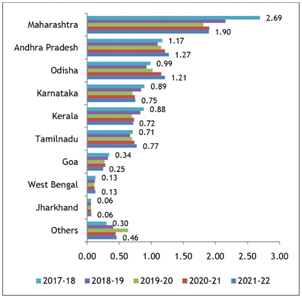
1.20 The State-wise data reveals that Maharashtra has the highest share in RCN production, accounting for 25% of the total production in 2021-22, followed by Andhra Pradesh (17%) and Odisha (16%). While Maharashtra witnessed a steep decline during 2017-18 to 2021-22, production increased in Andhra Pradesh and Odisha. Kerala is ranked sixth after Tamil Nadu and Karnataka. Kerala witnessed a decline in production during the period. Figure 1.11 shows the production of RCN in various States of India from 2017-18 to 2021-22.</p.
1.18 Cashew cultivation in India has expanded from 10.41 lakh hectares in 2017-18 to 11.84 lakh hectares in 2021-22, a growth of 13.74 percent. Odisha has the largest area under cashew cultivation with 2.23 lakh hectares, followed by Andhra Pradesh with 1.98 lakh hectares and Maharashtra with 1.91 lakh hectares. Kerala is in the sixth position with an area of 1.07 lakh hectares. Table 1.3 shows the area under cashew cultivation in different States from 2017-18 to 2021-22.
Table 1.3: Area under Cashew Cultivation in India (in Lakh Hectares)
| Sl. No. | States | 2017-18 | 2018-19 | 2019-20 | 2020-21 | 2021-22 |
| 1 | Odisha | 1.83 | 2.05 | 2.14 | 2.14 | 2.23 |
| 2 | Andhra Pradesh | 1.86 | 1.91 | 1.92 | 1.96 | 1.98 |
| 3 | Maharashtra | 1.86 | 1.91 | 1.91 | 1.91 | 1.91 |
| 4 | Tamilnadu | 1.42 | 1.46 | 1.5 | 1.67 | 1.73 |
| 5 | Karnataka | 1.28 | 1.3 | 1.32 | 1.37 | 1.38 |
| 6 | Kerala | 0.91 | 0.97 | 0.99 | 1.03 | 1.07 |
| 7 | Goa | 0.58 | 0.58 | 0.58 | 0.59 | 0.59 |
| 8 | Jharkhand | 0.15 | 0.16 | 0.16 | 0.16 | 0.16 |
| 9 | West Bengal | 0.11 | 0.11 | 0.11 | 0.11 | 0.15 |
| 10 | Others | 0.41 | 0.43 | 0.6 | 0.63 | 0.64 |
| Total | 10.41 | 10.89 | 11.24 | 11.59 | 11.84 |
Source: CEPCI
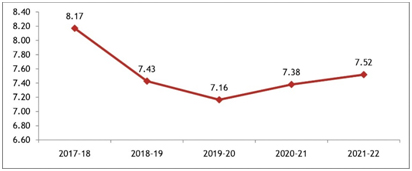
1.19 The RCN production of India during 2017-18 was 8.17 lakh MT, which had declined to 7.16 lakh MT in 2019-20 (Refer Figure 1.10). There after, it increased to 7.52 lakh MT in 2021-22.
Figure 1.10: Production of RCN in India (2017-18 to 2021-22) (Qty. in Lakh MT)
Source: CEPCI
1.20 The State-wise data reveals that Maharashtra has the highest share in RCN production, accounting for 25% of the total production in 2021-22, followed by Andhra Pradesh (17%) and Odisha (16%). While Maharashtra witnessed a steep decline during 2017-18 to 2021-22, production increased in Andhra Pradesh and Odisha. Kerala is ranked sixth after Tamil Nadu and Karnataka. Kerala witnessed a decline in production during the period. Figure 1.11 shows the production of RCN in various States of India from 2017-18 to 2021-22.
Figure 1.11: State wise RCN Production in India (Qty. in Lakh MT)
Source: CEPCI
1.21 The domestic production of RCN is only about 7.50 lakh MT (2021-22), while the estimated processing capacity is 20.00 lakh MT. To increase the domestic production, the Department of Agriculture, Cooperation and Farmers Welfare (DAC&FW) has approved the roadmap programme of Directorate of Cashew nut & Cocoa Development (DCCD) to expand the area of cashew cultivation and replace senile plantations with high yielding varieties. The Cashew Export Promotion Council of India (CEPCI) has also proposed a roadmap to achieve RCN production of 20.00 lakh MT by 2025.
1.22 From 2001-02 to 2020-21, India imported 138.35 lakh MT of RCN for an amount of ` 94,996.54 crore indicating high internal demand for imported RCN. The average value of RCN imported into India during 2021-22 was ` 97.74 per kg. Ivory coast, Tanzania, Guinea Bissau, Benin, Ghana, Mozambique, Nigeria, Senegal, etc. were the major sources of RCN import. The details of RCN import to India from 2001-02 to 2020-21 is provided in Table 1.4.
Table 1.4: Raw Cashew Nut (RCN) Imports to India
| Sl. No. | Year | RCN Imports to India | |
| Quantity (in Lakh MT) | Value (`in Crore) | ||
| 1 | 2001-2002 | 3.56 | 950.00 |
| 2 | 2002-2003 | 4.01 | 1237.00 |
| 3 | 2003-2004 | 4.52 | 1401.00 |
| 4 | 2004-2005 | 5.79 | 2191.00 |
| 5 | 2005-2006 | 5.65 | 2163.00 |
| 6 | 2006-2007 | 5.93 | 1811.62 |
| 7 | 2007-2008 | 6.06 | 1746.80 |
| 8 | 2008-2009 | 6.06 | 2632.41 |
| 9 | 2009-2010 | 7.53 | 3037.09 |
| 10 | 2010-2011 | 5.30 | 2649.00 |
| 11 | 2011-2012 | 8.10 | 5338.64 |
| 12 | 2012-2013 | 8.92 | 5331.74 |
| 13 | 2013-2014 | 7.71 | 4563.99 |
| 14 | 2014-2015 | 9.40 | 6570.93 |
| 15 | 2015-2016 | 9.58 | 8561.01 |
| 16 | 2016-2017 | 7.70 | 8839.42 |
| 17 | 2017-2018 | 6.49 | 8850.03 |
| 18 | 2018-2019 | 8.35 | 10929.00 |
| 19 | 2019-2020 | 9.38 | 8861.58 |
| 20 | 2020-2021 | 8.31 | 7331.28 |
| Total | 138.35 | 94996.54 | |
Source: DCCD
1.23 The export of cashew kernels in 2021-22 is only about half that in 2015-16. The export earnings of cashew kernels also showed a decline, but not as steep as in the quantity of exports. Table 1.5 displays the export of cashew kernels from India in terms of quantity & value for the period of 2002-2022.
Table 1.5: Cashew Kernel Exports from India
| Sl. No. | Year | Cashew Kernel Export | |
| (Quantity in Lakh MT) | Value (` In Crore) | ||
| 1 | 2002-2003 | 1.04 | 1933.00 |
| 2 | 2003-2004 | 1.01 | 1804.00 |
| 3 | 2004-2005 | 1.27 | 2709.00 |
| 4 | 2005-2006 | 1.14 | 2515.00 |
| 5 | 2006-2007 | 1.19 | 2455.15 |
| 6 | 2007-2008 | 1.14 | 2289.02 |
| 7 | 2008-2009 | 1.10 | 2988.40 |
| 8 | 2009-2010 | 1.18 | 2801.60 |
| 9 | 2010-2011 | 1.06 | 2819.39 |
| 10 | 2011-2012 | 1.32 | 4390.68 |
| 11 | 2012-2013 | 1.00 | 4067.21 |
| 12 | 2013-2014 | 1.15 | 5058.73 |
| 13 | 2014-2015 | 1.19 | 5432.85 |
| 14 | 2015-2016 | 0.96 | 4952.12 |
| 15 | 2016-2017 | 0.82 | 5168.78 |
| 16 | 2017-2018 | 0.85 | 5912.81 |
| 17 | 2018-2019 | 0.67 | 4434.01 |
| 18 | 2019-2020 | 0.68 | 3867.17 |
| 19 | 2020-2021 | 0.50 | 2906.99 |
| 20 | 2021-2022 | 0.54 | 3175.20 |
| Total | 19.80 | 71681.11 | |
Source: DCCD
1.24 The customs duty was brought down to 2.5 % from 5% w.e.f 01.02.2018. Further, the Union government allowed duty free import of RCN from Least Developed Countries (LDCs) under Duty Free Tariff Preference (DFTP) Scheme.
1.25 India exported cashew kernels to several countries, including European, Asian, Middle Eastern, North American and African countries. In 2021-22, the exports was highest to United Arab Emirates (U.A.E) with a share of 31 % in both quantity and value. The second and third largest importers of Indian cashew kernels were Netherlands and Japan, respectively. The top three countries together constituted more than fifty per cent of the total exports. Saudi Arabia and the United States of America (U.S.A) were also significant importers of the Indian cashew kernels. Some of the other notable importers were Spain, Germany, Malaysia, Singapore, Kuwait, Iran and Canada.
1.26 India’s export destinations have changed significantly over the years. The UAE was the top importer of Indian cashew kernels in both 2017-18 and 2021-22, but the exports decreased by 21.63 % in value terms. The Netherlands, Japan, Saudi Arabia and the U.S.A were the other major importers of Indian cashew kernels in 2017-18, but their ranks and shares declined considerably in 2021-22. The U.S.A, for instance, slipped from the second position to the sixth position. On the other hand, some countries increased their imports of Indian cashew kernels over the years. Germany, for example, rose from the fifteenth position to the eighth position. Iran also emerged as a significant importer of Indian cashew kernels, jumping from the twenty-sixth position to the sixteenth position. The country wise export of cashew kernels from India is shown in Table 1.6.
Table 1.6: Country wise Cashew Kernel Exports from India (2017-18 & 2021-22)
| Sl. No. | Countries | 2017-18 | 2021-2022 | ||
| QTY (MT) | VALUE (`InCrore) | QTY (MT) | VALUE (` In Crore) | ||
| 1 | U.A.E | 17570.00 | 1252.29 | 16575.20 | 981.46 |
| 2 | Netherlands | 8650.00 | 584.05 | 5511.90 | 305.91 |
| 3 | Japan | 8509.00 | 596.85 | 5683.54 | 431.21 |
| 4 | Saudi Arabia | 7827.00 | 552.36 | 4769.83 | 286.92 |
| 5 | U.S.A | 13179.00 | 906.14 | 2791.54 | 163.78 |
| 6 | Belgium | 2534.00 | 182.16 | 374.37 | 20.56 |
| 7 | Spain | 3278.00 | 229.44 | 2425.45 | 160.25 |
| 8 | Kuwait | 2067.00 | 150.58 | 1829.82 | 109.22 |
| 9 | Germany | 1153.00 | 82.82 | 1877.36 | 119.16 |
| 10 | France | 2135.00 | 154.33 | 118.23 | 5.75 |
| 11 | Qatar | 1268.00 | 88.95 | 1329.67 | 79.45 |
| 12 | U.K | 1129.00 | 77.70 | 539.82 | 32.30 |
| 13 | Greece | 1978.00 | 136.17 | 712.66 | 43.92 |
| 14 | Singapore | 1825.00 | 124.93 | 926.62 | 57.54 |
| 15 | Korea Rep. | 603.00 | 41.77 | 219.47 | 14.22 |
| 16 | Malaysia | 613.00 | 41.83 | 1012.84 | 58.80 |
| 17 | Bahrain | 442.00 | 31.75 | 721.73 | 43.12 |
| 18 | Trinidad | 1541.00 | 108.41 | 127.01 | 6.94 |
| 19 | Turkey | 531.00 | 34.20 | 62.65 | 3.23 |
| 20 | Canada | 677.00 | 42.65 | 100.41 | 3.48 |
| 21 | Israel | 861.00 | 53.29 | 90.98 | 6.06 |
| 22 | Italy | 383.00 | 20.79 | 109.84 | 5.73 |
| 23 | Jordan | 461.00 | 33.58 | 12.10 | 1.12 |
| 24 | Iran | 60.00 | 3.56 | 522.00 | 29.77 |
| 25 | Algeria | 267.00 | 19.62 | 30.00 | 1.62 |
| 26 | Others | 5424.00 | 362.59 | 5294.84 | 203.68 |
| Total | 84965.00 | 5912.81 | 53769.88 | 3175.20 | |
Source: CEPCI
1.27 The export of salted and roasted cashew kernels from India, which forms less than 5 per cent of the total cashew kernel exports, has decreased by 11.21 % and 3.30 % in quantity and value terms respectively between 2017-18 and 2021-22. The details are shown in Table 1.7.
Table 1.7: Export of Salted & Roasted Cashew Kernels (2017-18 & 2021-22)
| Sl. No. | Year | Export of Salted & Roasted Cashew Kernels | |
| MT | (`in Crore) | ||
| 1 | 2017-18 | 2872 | 182.73 |
| 2 | 2018-19 | 1473 | 106.82 |
| 3 | 2019-20 | 2128 | 149.51 |
| 4 | 2020-21 | 2035 | 138.29 |
| 5 | 2021-22 | 2550 | 176.7 |
| Total | 11058 | 754.05 | |
Source: CEPCI
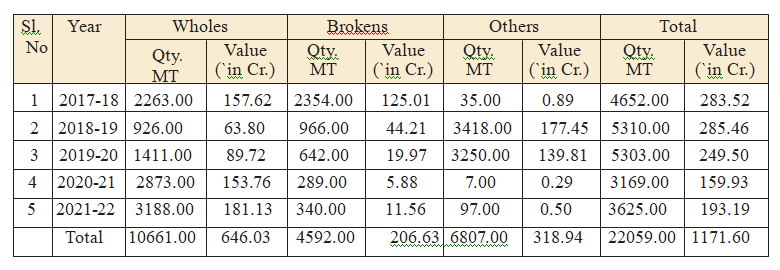
1.28 Even though the total import volume of cashew kernels showed a decline during the five years ending 2021-22, the import of whole kernels showed an increase despite the interventions discussed above. However, the import of broken nuts and other categories declined sharply in 2020-21 and 2021-22. Wholes constituted as high as 88% of the total kernel imports to India in terms of quantity and 94% in terms of value in 2021- 22. The value of imports ranged between ` 160 crores and ` 285 crores during the five year period ending 2021-22. Table 1.8 shows the import data from 2017-18 to 2021-22.
Table 1.8: Cashew Kernel Imports to India from 2017-18 to 2021-22
| Sl. No. | Year | Wholes | Brokens | Others | Total | ||||
| Qty. MT | Value (` in Cr.) | Qty. MT | Value (` in Cr.) | Qty. MT | Value (` in Cr.) | Qty. MT | Value (` in Cr.) | ||
| 1 | 2017-18 | 2263.00 | 157.62 | 2354.00 | 125.01 | 35.00 | 0.89 | 4652.00 | 283.52 |
| 2 | 2018-19 | 926.00 | 63.80 | 966.00 | 44.21 | 3418.00 | 177.45 | 5310.00 | 285.46 |
| 3 | 2019-20 | 1411.00 | 89.72 | 642.00 | 19.97 | 3250.00 | 139.81 | 5303.00 | 249.50 |
| 4 | 2020-21 | 2873.00 | 153.76 | 289.00 | 5.88 | 7.00 | 0.29 | 3169.00 | 159.93 |
| 5 | 2021-22 | 3188.00 | 181.13 | 340.00 | 11.56 | 97.00 | 0.50 | 3625.00 | 193.19 |
| Total | 10661.00 | 646.03 | 4592.00 | 206.63 | 6807.00 | 318.94 | 22059.00 | 1171.60 |
Source: CEPCI
1.29 India also exports a limited quantity of CNSL and Cardanol. The total value of exports was only ` 32.5 crores in 2021-22. It is also observed that the quantity of exports witnessed a decline after 2015-16. More than half of the Indian exports was to three countries viz., Republic of Korea (28%), Belgium (19%) and Spain (6%). The export of CNSL and Cardanol from India from 2002 - 03 to 2021-22 is given in Table 1.9.
Table 1.9: Cashew Nut Shell Liquid & Cardanol
| Sl. No. | Year | CNSL & Cardanol Exports from India | |
| Quantity (in MT) | Value (` In Crore) | ||
| 1 | 2002-2003 | 7215 | 9.26 |
| 2 | 2003-2004 | 6926 | 7.03 |
| 3 | 2004-2005 | 7474 | 7.91 |
| 4 | 2005-2006 | 6405 | 7.09 |
| 5 | 2006-2007 | 6139 | 10.29 |
| 6 | 2007-2008 | 7813 | 11.98 |
| 7 | 2008-2009 | 9099 | 26.06 |
| 8 | 2009-2010 | 11227 | 27.62 |
| 9 | 2010-2011 | 12051 | 33.77 |
| 10 | 2011-2012 | 13575 | 59.46 |
| 11 | 2012-2013 | 9192 | 29.84 |
| 12 | 2013-2014 | 9480 | 38.61 |
| 13 | 2014-2015 | 10938 | 55.81 |
| 14 | 2015-2016 | 11677 | 57.59 |
| 15 | 2016-2017 | 11422 | 44.00 |
| 16 | 2017-2018 | 8325 | 32.63 |
| 17 | 2018-2019 | 5300 | 26.85 |
| 18 | 2019-2020 | 4605 | 23.09 |
| 19 | 2020-2021 | 3735 | 19.72 |
| 20 | 2021-2022 | 4944 | 32.50 |
| Total | 167542 | 561.11 | |
Source: DCCD & CEPCI
1.30 Other cashew products include Shell Cake, Testa, Cashew Apple and Gum. The de-oiled cashew shell or cashew shell cake, is a by- product of extracting CNSL. It can be carbonized and combined with a binder to form briquettes that can be used as fuel for industrial boilers. It can also be processed into vermiculite, a product that is useful for gardening and hydroponics. The thin skin covering the kernel called testa has high tannin content and is used as a raw material for tanning agent in the leather industry. Cashew apple, a rich source of vitamin C and antioxidants, is made into pectin and juices, as well as alcoholic drinks, vinegars, syrups and jams. The fibrous waste from juicing cashew apple is used as an animal feed or as a carotenoid-rich ingredient for food supplements or natural food colours. Cashew apple juice is produced in Brazil, Senegal and Vietnam, and in Ghana, where cashew apple brandy is another popular product. Cashew gum that comes out of the cashew tree’s bark, has many uses in the food industry and pharmaceuticals. However, there has been only limited success in making these products in India.
1.31 Cashew kernels are graded in India based on their colour, shape and size. There are 20 grades of cashew kernels in India. White kernels and Scorched kernels are the two-colour categories. Wholes, Splits, Butts and Pieces are the four shape categories. The Wholes have five size categories: 180, 210, 240, 320 and 450. The Splits, Butts and Pieces have three size categories: large, small and baby. Table 1.10 shows the grading system used by India for cashew kernels.
Table 1.10: Indian Grading System
| Sl.No. | Grade | Description |
| 1 | WW-180 | White Wholes 180 |
| 2 | SW-180 | Scorched Wholes 180 |
| 3 | WW-210 | White Wholes 210 |
| 4 | WW-240 | White Wholes 240 |
| 5 | SW-240 | Scorched Wholes 240 |
| 6 | SW-210 | Scorched Wholes 210 |
| 5 | WW-320 | White Wholes 320 |
| 6 | WW-450 | White Wholes 450 |
| 7 | SW-450 | Scorched Wholes 450 |
| 8 | SW-320 | Scorched Wholes 320 |
| 9 | S | Splits |
| 10 | SW | Scorched Wholes |
| 11 | SSW | Scorched Wholes Second |
| 12 | SS | Scorched Splits |
| 13 | B | Butts |
| 14 | LWP | Large White Pieces |
| 15 | SP | Scorched Pieces |
| 16 | SB | Scorched Butts |
| 17 | SPS | Scorched Pieces Seconds |
| 18 | SWP | Small White Pieces |
| 19 | SSP | Scorched Small Pieces |
| 20 | BB | Baby Butts |
Source: Indian Cashew Nuts Grade Chart
1.1 The cashew industry has a long history, dating back to the tropical regions of the Americas, especially the north-east of Brazil. The Tupi people, who were the original inhabitants of that land, knew how to cultivate and consume the cashew called acajú. The cashew trees were part of the Columbian exchange, a process of biological and cultural transfer that occurred after the European exploration of the Americas. The Portuguese and Spanish explorers carried the cashew trees to Asia and Africa around 1500 AD, where they became an important crop. The cashew was recorded by the French, Portuguese and Dutch sailors in the 16th century, who were impressed by its taste. Andre Thevet illustrated cashew in his book Les singularitez de la France Antarctique in 1557, which was one of the first accounts of cashew. In Africa it was first introduced in the east coast in Mozambique and from there it spread to the West Coast. In India, cashew was first introduced in the Malabar Coast by the Portuguese in the 16th century for preventing soil erosion, as per report in the book “The Agronomy & Economy of Important Tree Crops of the Developing World”. From there it spread to other parts of the country as well as to Southeast Asia. The tree adapted well to the climate of Asia and Africa, where it spread naturally and became a common sight in family gardens and wild forests. India was the first to develop the modern cashew processing industry and had a strong position in the global market for a long time.
1.2 The relative position of countries changed significantly during the last five decades. For instance, the countries like Benin and Cote d’Ivoire only began large scale cashew production in the 1990s, but have since recorded higher growth rates. Mozambique was the world’s largest cashew producer in the early 1960s, but production declined significantly in the early 1970s. The United Republic of Tanzania experienced a similar decline in cashew output throughout the 1970s and 1980s but has seen a revival since 2010. Vietnam did not grow cashew on a significant scale before the 1980s, when the Government began to promote the development of the cashew sector. Production in India has followed a path of steady growth since the early 1960s. However, of late, its position started deteriorating as a result of the growing competition from other Countries. Cashew is now grown mainly in Africa, Asia and South America. Africa is the world’s leading producer of Raw Cashew Nut (RCN), accounting for more than half of the global output. The continent has a favorable climate and soil for cashew cultivation. African countries such as Cote d’Ivoire, Tanzania, Burundi, Mozambique, Benin, Guinea- Bissau, Burkina Faso and Ghana are major suppliers of RCN. A growing number of these nations are also foraying in to cashew processing. Asian producers, include India, Cambodia, Vietnam and Indonesia.
TREE NUT PRODUCTION, VALUE AND CONSUMPTION 1.3 Tree nuts include Almonds, Walnuts, Cashews, Pistachios, Hazelnuts, Pecans, Macadamias, Pine Nuts and Brazil Nuts. A remarkable growth of 60.74% has been observed in the global production of tree nuts in the last ten years, reaching 53.75 lakh MT of kernels in 2022-23 from 33.44 lakh MT in 2013 - 14. Cashew kernels, which contributed 18 % of the total kernel output with 6.02 lakh MT in 2013-14, increased its share to 20 % with 10.95 lakh MT in 2022-23. Figure 1.1 displays the quantity of cashew output and world’s tree nut output from 2013-14 to 2022-23. Figure 1.1: Global Production of Tree Nuts and Cashew Nuts (Quantity in Lakh MT on Kernel basis)
Source: Statistical Yearbook 2022-23, INC
1.4 The value of tree nuts produced globally increased from 26.84 Bn USD in 2013-14 to 35.86 Bn USD in 2022-23, an increase of 33.61 per cent. Cashew contributed significantly to this growth, as its share increased from 15.46 per cent in 2013-14 to 21.67 per cent in 2022-23. Figure 1.2 shows the trend of cashew supply value from 2013-14 to 2022-23.
Figure 1.2: Global Supply Value of Tree Nuts and Cashew Nuts (Value in Billion USD)
1.5 Among the tree nuts, almonds topped the list in global consumption with 15.71 lakh MT, followed by Walnuts with 9.77 lakh MT and Cashews with 9.65 lakh MT. Figure 1.3 presents the consumption pattern of tree nuts in 2021-22.
Figure 1.3: Share of Different Tree Nuts in Global Consumption of Tree Nuts during 2021-22
Source: Nuts & Dried Fruits Statistical Yearbook 2022-23, INC
1.6 Asia ranks first in tree nut consumption, followed by Europe, North America and Middle East. The region wise consumption of tree nut is illustrated in Figure 1.4.
Figure 1.4: Region wise Consumption Pattern of Tree Nuts during 2021-22
Source: Nuts & Dried Fruit Statistical Yearbook
2022-23, INC
1.7 The global production of RCN ranged from 2.90 to 5.63 lakh MT in the 1960s and 1970s, it started to increase in the 1980s and 1990s, reaching 12.18 lakh MT in 1995-96. The production of RCN accelerated in the 2000s and 2010s, reaching 37.06 lakh MT in 2017-18. The production of RCN declined slightly in 2018-19 to 34.84 lakh MT, but recovered in 2019-20 and 2020 - 21 to 36.76 and 41.46 lakh MT respectively. The production of RCN has increased to 50.00 lakh MT in 2022-23. The global production of RCN from 1960-61 to 2022-23 is presented in Figure 1.5.
Figure 1.5: Global Production of Raw Cashew Nuts (RCN) (Quantity in Lakh MT)
Source: Statistical database of Food and Agriculture Organization (FAO) & Statistical Yearbooks published by International Nut & Dried Fruit Council (INC).
1.8 The global production of RCN in the year 2020-21 was dominated by six countries: Cote d’Ivoire (20.5%), India (17.8%), Vietnam (8.4%), Burundi (7.3%) Philippines (6.2%) and Tanzania (5.6%). These countries collectively produced nearly two-thirds of the total RCN output in the world. The productivity of RCN, measured as the yield per hectare, varied significantly among countries. The productivity levels were very high in Philippines, Peru, Mali, Mexico, Sri Lanka and Malaysia, each produced more than 2000 kg of RCN per hectare. Among them, only Philippines and Mali produced a significant volume. The data on the area, production and productivity of RCN in various countries during the year 2020-21 is presented in Table 1.1.
Table 1.1: Global Production of Raw Cashew Nuts (RCN) during 2020-21
| Sl. No. | Country | Area (Ha) | Production (MT) | Productivity (kg/Ha) |
| 1 | Cote d'Ivoire | 2033886 | 848700 | 417 |
| 2 | India | 1158532 | 738009 | 684 |
| 3 | Vietnam | 280886 | 348504 | 1241 |
| 4 | Burundi | 277597 | 300910 | 1084 |
| 5 | Philippines | 29669 | 255915 | 8626 |
| 6 | United Republic of Tanzania | 816225 | 232681 | 285 |
| 7 | Benin | 524250 | 190000 | 362 |
| 8 | Mali | 40583 | 173207 | 4268 |
| 9 | Burkina Faso | 148636 | 162105 | 1091 |
| 10 | Guinea-Bissau | 291365 | 160630 | 551 |
| 11 | Brazil | 426131 | 139921 | 328 |
| 12 | Indonesia | 526022 | 131872 | 251 |
| 13 | Mozambique | 154858 | 128225 | 828 |
| 14 | Nigeria | 142553 | 98809 | 693 |
| 15 | Ghana | 155572 | 82420 | 530 |
| 16 | Sri Lanka | 15621 | 33655 | 2155 |
| 17 | Thailand | 15415 | 24320 | 1578 |
| 18 | Guinea | 11780 | 20856 | 1771 |
| 19 | Malaysia | 7607 | 16148 | 2123 |
| 20 | Kenya | 22690 | 12668 | 558 |
| 21 | Senegal | 21209 | 8750 | 413 |
| 22 | Togo | 5477 | 8111 | 1481 |
| Sl. No. | Country | Area (Ha) | Production (MT) | Productivity (kg/Ha) |
| 23 | Madagascar | 15329 | 7199 | 470 |
| 24 | Colombia | 2379 | 4443 | 1868 |
| 25 | Mexico | 1576 | 4077 | 2587 |
| 26 | Peru | 609 | 3670 | 6026 |
| 27 | Gambia | 1685 | 2767 | 1642 |
| 28 | Honduras | 1444 | 2094 | 1450 |
| 29 | Angola | 2656 | 2033 | 765 |
| 30 | Myanmar | 1711 | 1482 | 866 |
| 31 | El Salvador | 1517 | 936 | 617 |
| 32 | Dominican Republic | 9391 | 658 | 70 |
| 33 | China,mainland | 204 | 230 | 1128 |
| Total | 7145065 | 4146005 | 580 |
Source: CEPCI
1.9 Global cashew kernel production has increased significantly in the past decade reaching 10.95 lakh MT in 2022-23 from 6.02 lakh MT in 2013-14. India ranked second with 1.62 lakh MT (14.8%), followed by Cambodia with 1.54 lakh MT (14.1%) and Vietnam with 1.04 lakh MT (9.5%). Brazil and Indonesia contributed 3% and 2% of the global production respectively.
1.10 The global supply value of cashew kernels has increased by 87.23 per cent to 7.77 billion USD in 2022-23 from 4.15 billion USD in 2013-14. This is greater than that of other major tree nuts such as almonds, pistachios, walnuts, and hazelnuts.
1.11 The global cashew kernel exports shows a steady increase from 2011-12 to 2021-22 with only one year (2018-19) showing a slight decline. The export volume showed an overall growth of 6.48 % per annum. The highest export volume was recorded in 2021- 22, with 7.05 lakh MT. Figure 1.6 presents the volume of export of cashew kernels from 2011-12 to 2021-22.
Figure 1.6: Global Export of Cashew Kernels (Qty. in Lakh MT)
Source: Nuts & Dried Fruits Statistical Yearbook 2022-23, INC
1.12 During the year 2021-22, Vietnam was the leading exporter of cashew kernels with nearly two-thirds (65%) of the total volume. Its main customers were USA, European Union, United Kingdom and China. India remains as the second largest exporter of cashew kernel, with just 10 per cent share of the global exports. India’s major export destinations are Asia (UAE, Japan and Saudi Arabia), European Union and the United Kingdom. Netherlands is in the third position with a share of 6 per cent. The other major exporters include Germany, UAE, Brazil and Cote d’Ivoire, each with less than 5% of the total volume. However, Netherlands, Germany and UAE are only transit countries. The major exporters of cashew kernels during 2021-22 are shown in Figure 1.7.
Figure 1.7: Major Exporters of Cashew Kernels during 2021-22 (Qty. in Lakh MT)
Source: Nuts & Dried Fruits Statistical Yearbook 2022-23, INC Note: Netherlands, Germany and UAE are transit countries.
1.13 In 2021-22, USA imported the highest quantity of cashew kernels in the world, with 1.86 lakh MT. This was 0.71 lakh MT more than in 2011-12. Germany and Netherlands followed as the second and third largest importers of cashew kernels. China and UAE were the two major import destinations that reduced their cashew kernel imports since 2011-12. Figure 1.8 shows the
Figure 1.8 Country wise Import of Cashew Kernels (Qty. in Lakh MT)
Source :Nuts & Dried Fruits Statistical Yearbook 2022-23, INC global cashew kernel imports in 2021-22 and the changes from 2011-12.
1.14 The global consumption of cashew kernels has increased significantly in the past five years (Refer Table 1.2). The total consumption rose from 6,49,250 metric tons (MT) in 2017-18 to 7,92,892 MT in 2021-22, an increase of 22.10 per cent. However, the consumption patterns varied across countries, with some showing a remarkable growth and others experiencing a decline.
1.15 India, the largest consumer of cashew kernels in the world, witnessed the most notable increase in consumption. Indian consumption grew from 247,598 MT in 2017-18 to 322,160 MT in 2021-22, an increase of 30.1% over the five year period indicating the increasing popularity of cashew among the Indian consumers.
1.16 The second largest consumer of cashew kernels, the USA, also showed a significant growth in consumption, from 1,50,263 MT in 2017-18 to 1,82,814 MT in 2021-22. The factors that influence the consumption patterns include the availability and price of cashew kernels, competition from other nuts and dry fruits, changing consumer preferences, the trade relations and policies, and the socio-economic and environmental conditions.
Table 1.2: Global Consumption of Cashew Kernels (2017-18 & 2021-22)
| Sl. No. | Countries | 2017-18 (Consumption in MT) | 2021-22 (Consumption in MT) |
| 1 | India | 247598 | 322160 |
| 2 | USA | 150263 | 182814 |
| 3 | Germany | 56949 | 53621 |
| 4 | China | 48357 | 35063 |
| 5 | UK | 19891 | 22589 |
| 6 | France | 12772 | 17321 |
| 7 | Canada | 4579 | 16022 |
| Sl. No. | Countries | 2017-18 (Consumption in MT) | 2021-22 (Consumption in MT) |
| 8 | Australia | 15068 | 15855 |
| 9 | Russia | 7023 | 15623 |
| 10 | Italy | 6459 | 13905 |
| 11 | Japan | 10245 | 13813 |
| 12 | Poland | 6164 | 12813 |
| 13 | Turkey | 4027 | 11552 |
| 14 | Belgium | 6537 | 10744 |
| 15 | Saudi Arabia | 8175 | 9869 |
| 16 | Spain | 5656 | 9720 |
| 17 | Thailand | 7593 | 8747 |
| 18 | Iran | 10833 | 7391 |
| 19 | Brazil | 16914 | 7097 |
| 20 | Israel | 4147 | 6173 |
| Total | 649250 | 792892 |
Source: Nuts & Dried Fruits StatisticalYearbook2022-23, INC
1.17 The per capita consumption of cashew kernels is highest in Belgium, followed by Germany, USA, Italy and Israel during 2021-22. The estimated per capita annual consumption of India, as per INC data, is only 0.16 kg in 2021-22. It may be noted that nine countries have the per capita consumption above one kg per annum. The estimated per capita consumption (kg/year) of cashew kernels during 2021-22 is shown in Figure 1.9.
Figure 1.9: Country wise Per Capita Consumption of Cashew
Kernels in 2021 (Qty. in Kg/Year)
Source: Nuts & Dried Fruits Statistical Yearbook 2022-23, INC
1.20 The State-wise data reveals that Maharashtra has the highest share in RCN production, accounting for 25% of the total production in 2021-22, followed by Andhra Pradesh (17%) and Odisha (16%). While Maharashtra witnessed a steep decline during 2017-18 to 2021-22, production increased in Andhra Pradesh and Odisha. Kerala is ranked sixth after Tamil Nadu and Karnataka. Kerala
witnessed a decline in production during the period. Figure 1.11 shows the production of RCN in various States of India from 2017-18 to 2021-22.
1.18 Cashew cultivation in India has expanded from 10.41 lakh hectares in 2017-18 to 11.84 lakh hectares in 2021-22, a growth of 13.74 percent. Odisha has the largest area under cashew cultivation with 2.23 lakh hectares, followed by Andhra Pradesh with 1.98 lakh hectares and Maharashtra with 1.91 lakh hectares. Kerala is in the sixth position with an area of 1.07 lakh hectares. Table 1.3 shows the area under cashew cultivation in different States from 2017-18 to 2021-22.
Table 1.3: Area under Cashew Cultivation in India (in Lakh Hectares)
| Sl. No. | States | 2017-18 | 2018-19 | 2019-20 | 2020-21 | 2021-22 |
| 1 | Odisha | 1.83 | 2.05 | 2.14 | 2.14 | 2.23 |
| 2 | Andhra Pradesh | 1.86 | 1.91 | 1.92 | 1.96 | 1.98 |
| Sl. No. | States | 2017-18 | 2018-19 | 2019-20 | 2020-21 | 2021-22 |
| 3 | Maharashtra | 1.86 | 1.91 | 1.91 | 1.91 | 1.91 |
| 4 | Tamilnadu | 1.42 | 1.46 | 1.5 | 1.67 | 1.73 |
| 5 | Karnataka | 1.28 | 1.3 | 1.32 | 1.37 | 1.38 |
| 6 | Kerala | 0.91 | 0.97 | 0.99 | 1.03 | 1.07 |
| 7 | Goa | 0.58 | 0.58 | 0.58 | 0.59 | 0.59 |
| 8 | Jharkhand | 0.15 | 0.16 | 0.16 | 0.16 | 0.16 |
| 9 | West Bengal | 0.11 | 0.11 | 0.11 | 0.11 | 0.15 |
| 10 | Others | 0.41 | 0.43 | 0.6 | 0.63 | 0.64 |
| Total | 10.41 | 10.89 | 11.24 | 11.59 | 11.84 |
Source: CEPCI
1.19 The RCN production of India during 2017-18 was 8.17 lakh MT, which had declined to 7.16 lakh MT in 2019-20 (Refer Figure 1.10). There after, it increased to 7.52 lakh MT in 2021-22.
Figure 1.10: Production of RCN in India (2017-18 to 2021-22) (Qty. in Lakh MT)
Source: CEPCI
1.20 The State-wise data reveals that Maharashtra has the highest share in RCN production, accounting for 25% of the total production in 2021-22, followed by Andhra Pradesh (17%) and Odisha (16%). While Maharashtra witnessed a steep decline during 2017-18 to 2021-22, production increased in Andhra Pradesh and Odisha. Kerala is ranked sixth after Tamil Nadu and Karnataka. Kerala witnessed a decline in production during the period. Figure 1.11 shows the production of RCN in various States of India from 2017-18 to 2021-22.
Figure 1.11: State wise RCN Production in India (Qty. in Lakh MT)
Source: CEPCI
1.21 The domestic production of RCN is only about 7.50 lakh MT (2021-22), while the estimated processing capacity is 20.00 lakh MT. To increase the domestic production, the Department of Agriculture, Cooperation and Farmers Welfare (DAC&FW) has approved the roadmap programme of Directorate of Cashew nut & Cocoa Development (DCCD) to expand the area of cashew cultivation and replace senile plantations with high yielding varieties. The Cashew Export Promotion Council of India (CEPCI) has also proposed a roadmap to achieve RCN production of 20.00 lakh MT by 2025.
1.22 From 2001-02 to 2020-21, India imported 138.35 lakh MT of RCN for an amount of ` 94,996.54 crore indicating high internal demand for imported RCN. The average value of RCN imported into India during 2021-22 was ` 97.74 per kg. Ivory coast, Tanzania, Guinea Bissau, Benin, Ghana, Mozambique, Nigeria, Senegal, etc. were the major sources of RCN import. The details of RCN import to India from 2001-02 to 2020-21 is provided in Table 1.4.
Table 1.4: Raw Cashew Nut (RCN) Imports to India
| Sl. No. | Year | RCN Imports to India | |
| Quantity (in Lakh MT) | Value (`in Crore) | ||
| 1 | 2001-2002 | 3.56 | 950.00 |
| 2 | 2002-2003 | 4.01 | 1237.00 |
| 3 | 2003-2004 | 4.52 | 1401.00 |
| 4 | 2004-2005 | 5.79 | 2191.00 |
| 5 | 2005-2006 | 5.65 | 2163.00 |
| 6 | 2006-2007 | 5.93 | 1811.62 |
| 7 | 2007-2008 | 6.06 | 1746.80 |
| 8 | 2008-2009 | 6.06 | 2632.41 |
| 9 | 2009-2010 | 7.53 | 3037.09 |
| 10 | 2010-2011 | 5.30 | 2649.00 |
| 11 | 2011-2012 | 8.10 | 5338.64 |
| 12 | 2012-2013 | 8.92 | 5331.74 |
| 13 | 2013-2014 | 7.71 | 4563.99 |
| 14 | 2014-2015 | 9.40 | 6570.93 |
| 15 | 2015-2016 | 9.58 | 8561.01 |
| 16 | 2016-2017 | 7.70 | 8839.42 |
| 17 | 2017-2018 | 6.49 | 8850.03 |
| 18 | 2018-2019 | 8.35 | 10929.00 |
| Sl. No. | Year | RCNImportsto
India |
|
| Quantity (in Lakh MT) | Value (`in Crore) | ||
| 19 | 2019-2020 | 9.38 | 8861.58 |
| 20 | 2020-2021 | 8.31 | 7331.28 |
| Total | 138.35 | 94996.54 | |
Source: DCCD
1.23 The export of cashew kernels in 2021-22 is only about half that in 2015-16. The export earnings of cashew kernels also showed a decline, but not as steep as in the quantity of exports. Table 1.5 displays the export of cashew kernels from India in terms of quantity & value for the period of 2002-2022.
Table 1.5: Cashew Kernel Exports from India
| Sl. No. | Year | Cashew Kernel Export | |
| (Quantity in Lakh MT) | Value (` In Crore) | ||
| 1 | 2002-2003 | 1.04 | 1933.00 |
| 2 | 2003-2004 | 1.01 | 1804.00 |
| 3 | 2004-2005 | 1.27 | 2709.00 |
| 4 | 2005-2006 | 1.14 | 2515.00 |
| 5 | 2006-2007 | 1.19 | 2455.15 |
| 6 | 2007-2008 | 1.14 | 2289.02 |
| 7 | 2008-2009 | 1.10 | 2988.40 |
| Sl. No. | Year | CashewKernel Export | |
| (Quantity in Lakh MT) | Value (` In Crore) | ||
| 8 | 2009-2010 | 1.18 | 2801.60 |
| 9 | 2010-2011 | 1.06 | 2819.39 |
| 10 | 2011-2012 | 1.32 | 4390.68 |
| 11 | 2012-2013 | 1.00 | 4067.21 |
| 12 | 2013-2014 | 1.15 | 5058.73 |
| 13 | 2014-2015 | 1.19 | 5432.85 |
| 14 | 2015-2016 | 0.96 | 4952.12 |
| 15 | 2016-2017 | 0.82 | 5168.78 |
| 16 | 2017-2018 | 0.85 | 5912.81 |
| 17 | 2018-2019 | 0.67 | 4434.01 |
| 18 | 2019-2020 | 0.68 | 3867.17 |
| 19 | 2020-2021 | 0.50 | 2906.99 |
| 20 | 2021-2022 | 0.54 | 3175.20 |
| Total | 19.80 | 71681.11 | |
Source: DCCD
1.24 The customs duty was brought down to 2.5 % from 5% w.e.f 01.02.2018. Further, the Union government allowed duty free import of RCN from Least Developed Countries (LDCs) under Duty Free Tariff Preference (DFTP) Scheme.
1.25 India exported cashew kernels to several countries, including European, Asian, Middle Eastern, North American and African countries. In 2021-22, the exports was highest to United Arab Emirates (U.A.E) with a share of 31 % in both quantity and value. The second and third largest importers of Indian cashew kernels were Netherlands and Japan, respectively. The top three countries together constituted more than fifty per cent of the total exports. Saudi Arabia and the United States of America (U.S.A) were also significant importers of the Indian cashew kernels. Some of the other notable importers were Spain, Germany, Malaysia, Singapore, Kuwait, Iran and Canada.
1.26 India’s export destinations have changed significantly over the years. The UAE was the top importer of Indian cashew kernels in both 2017-18 and 2021-22, but the exports decreased by 21.63 % in value terms. The Netherlands, Japan, Saudi Arabia and the U.S.A were the other major importers of Indian cashew kernels in 2017-18, but their ranks and shares declined considerably in 2021-22. The U.S.A, for instance, slipped from the second position to the sixth position. On the other hand, some countries increased their imports of Indian cashew kernels over the years. Germany, for example, rose from the fifteenth position to the eighth position. Iran also emerged as a significant importer of Indian cashew kernels, jumping from the twenty-sixth position to the sixteenth position. The country wise export of cashew kernels from India is shown in Table 1.6.
Table 1.6: Country wise Cashew Kernel Exports from India (2017-18 & 2021-22)
| Sl. No. | Countries | 2017-18 | 2021-2022 | ||
| QTY (MT) | VALUE
(`InCrore) |
QTY (MT) | VALUE
(` In Crore) |
||
| 1 | U.A.E | 17570.00 | 1252.29 | 16575.20 | 981.46 |
| 2 | Netherlands | 8650.00 | 584.05 | 5511.90 | 305.91 |
| 3 | Japan | 8509.00 | 596.85 | 5683.54 | 431.21 |
| 4 | Saudi Arabia | 7827.00 | 552.36 | 4769.83 | 286.92 |
| 5 | U.S.A | 13179.00 | 906.14 | 2791.54 | 163.78 |
| 6 | Belgium | 2534.00 | 182.16 | 374.37 | 20.56 |
| 7 | Spain | 3278.00 | 229.44 | 2425.45 | 160.25 |
| 8 | Kuwait | 2067.00 | 150.58 | 1829.82 | 109.22 |
| 9 | Germany | 1153.00 | 82.82 | 1877.36 | 119.16 |
| 10 | France | 2135.00 | 154.33 | 118.23 | 5.75 |
| 11 | Qatar | 1268.00 | 88.95 | 1329.67 | 79.45 |
| 12 | U.K | 1129.00 | 77.70 | 539.82 | 32.30 |
| 13 | Greece | 1978.00 | 136.17 | 712.66 | 43.92 |
| 14 | Singapore | 1825.00 | 124.93 | 926.62 | 57.54 |
| 15 | Korea Rep. | 603.00 | 41.77 | 219.47 | 14.22 |
| 16 | Malaysia | 613.00 | 41.83 | 1012.84 | 58.80 |
| 17 | Bahrain | 442.00 | 31.75 | 721.73 | 43.12 |
| 18 | Trinidad | 1541.00 | 108.41 | 127.01 | 6.94 |
| 19 | Turkey | 531.00 | 34.20 | 62.65 | 3.23 |
| 20 | Canada | 677.00 | 42.65 | 100.41 | 3.48 |
| 21 | Israel | 861.00 | 53.29 | 90.98 | 6.06 |
| 22 | Italy | 383.00 | 20.79 | 109.84 | 5.73 |
| 23 | Jordan | 461.00 | 33.58 | 12.10 | 1.12 |
| 24 | Iran | 60.00 | 3.56 | 522.00 | 29.77 |
| 25 | Algeria | 267.00 | 19.62 | 30.00 | 1.62 |
| 26 | Others | 5424.00 | 362.59 | 5294.84 | 203.68 |
| Total | 84965.00 | 5912.81 | 53769.88 | 3175.20 | |
Source: CEPCI
1.27 The export of salted and roasted cashew kernels from India, which forms less than 5 per cent of the total cashew kernel exports, has decreased by 11.21 % and 3.30 % in quantity and value terms respectively between 2017-18 and 2021-22. The details are shown in Table 1.7.
Table 1.7: Export of Salted & Roasted Cashew Kernels (2017-18 & 2021-22)
| Sl. No. | Year | ExportofSalted&RoastedCashewKernels | |
| MT | (`in Crore) | ||
| 1 | 2017-18 | 2872 | 182.73 |
| 2 | 2018-19 | 1473 | 106.82 |
| 3 | 2019-20 | 2128 | 149.51 |
| 4 | 2020-21 | 2035 | 138.29 |
| 5 | 2021-22 | 2550 | 176.7 |
| Total | 11058 | 754.05 | |
Source: CEPCI
1.28 Even though the total import volume of cashew kernels showed a decline during the five years ending 2021-22, the import of whole kernels showed an increase despite the interventions discussed above. However, the import of broken nuts and other categories declined sharply in 2020-21 and 2021-22. Wholes constituted as high as 88% of the total kernel imports to India in terms of quantity and 94% in terms of value in 2021- 22. The value of imports ranged between ` 160 crores and ` 285 crores during the five year period ending 2021-22. Table 1.8 shows the import data from 2017-18 to 2021-22.
Table 1.8: Cashew Kernel Imports to India from 2017-18 to 2021-22
Source: CEPCI
1.29 India also exports a limited quantity of CNSL and Cardanol. The total value of exports was only ` 32.5 crores in 2021-22. It is also observed that the quantity of exports witnessed a decline after 2015-16. More than half of the Indian exports was to three countries viz., Republic of Korea (28%), Belgium (19%) and Spain (6%). The export of CNSL and Cardanol from India from 2002 - 03 to 2021-22 is given in Table 1.9.
Table 1.9: Cashew Nut Shell Liquid & Cardanol
| Sl. No. | Year | CNSL&Cardanol ExportsfromIndia | |
| Quantity (in MT) | Value (` In Crore) | ||
| 1 | 2002-2003 | 7215 | 9.26 |
| 2 | 2003-2004 | 6926 | 7.03 |
| 3 | 2004-2005 | 7474 | 7.91 |
| 4 | 2005-2006 | 6405 | 7.09 |
| Sl. No. | Year | CNSL & Cardanol Exports from India | |
| Quantity (in MT) | Value (` In Crore) | ||
| 5 | 2006-2007 | 6139 | 10.29 |
| 6 | 2007-2008 | 7813 | 11.98 |
| 7 | 2008-2009 | 9099 | 26.06 |
| 8 | 2009-2010 | 11227 | 27.62 |
| 9 | 2010-2011 | 12051 | 33.77 |
| 10 | 2011-2012 | 13575 | 59.46 |
| 11 | 2012-2013 | 9192 | 29.84 |
| 12 | 2013-2014 | 9480 | 38.61 |
| 13 | 2014-2015 | 10938 | 55.81 |
| 14 | 2015-2016 | 11677 | 57.59 |
| 15 | 2016-2017 | 11422 | 44.00 |
| 16 | 2017-2018 | 8325 | 32.63 |
| 17 | 2018-2019 | 5300 | 26.85 |
| 18 | 2019-2020 | 4605 | 23.09 |
| 19 | 2020-2021 | 3735 | 19.72 |
| 20 | 2021-2022 | 4944 | 32.50 |
| Total | 167542 | 561.11 | |
Source: DCCD & CEPCI
1.30 Other cashew products include Shell Cake, Testa, Cashew Apple and Gum. The de-oiled cashew shell or cashew shell cake, is a by- product of extracting CNSL. It can be carbonized and combined with a binder to form briquettes that can be used as fuel for industrial boilers. It can also be processed into vermiculite, a product that is useful for gardening and hydroponics. The thin skin covering the kernel called testa has high tannin content and is used as a raw material for tanning agent in the leather industry. Cashew apple, a rich source of vitamin C and antioxidants, is made into pectin and juices, as well as alcoholic drinks, vinegars, syrups and jams. The fibrous waste from juicing cashew apple is used as an animal feed or as a carotenoid-rich ingredient for food supplements or natural food colours. Cashew apple juice is produced in Brazil, Senegal and Vietnam, and in Ghana, where cashew apple brandy is another popular product. Cashew gum that comes out of the cashew tree’s bark, has many uses in the food industry and pharmaceuticals. However, there has been only limited success in making these products in India.
1.31 Cashew kernels are graded in India based on their colour, shape and size. There are 20 grades of cashew kernels in India. White kernels and Scorched kernels are the two-colour categories. Wholes, Splits, Butts and Pieces are the four shape categories. The Wholes have five size categories: 180, 210, 240, 320 and 450. The Splits, Butts and Pieces have three size categories: large, small and baby. Table 1.10 shows the grading system used by India for cashew kernels.
Table 1.10: Indian Grading System
| Sl.No. | Grade | Description |
| 1 | WW-180 | White Wholes 180 |
| 2 | SW-180 | Scorched Wholes 180 |
| 3 | WW-210 | White Wholes 210 |
| 4 | WW-240 | White Wholes 240 |
| 5 | SW-240 | Scorched Wholes 240 |
| 6 | SW-210 | Scorched Wholes 210 |
| 5 | WW-320 | White Wholes 320 |
| Sl.No. | Grade | Description |
| 6 | WW-450 | White Wholes 450 |
| 7 | SW-450 | Scorched Wholes 450 |
| 8 | SW-320 | Scorched Wholes 320 |
| 9 | S | Splits |
| 10 | SW | Scorched Wholes |
| 11 | SSW | Scorched Wholes Second |
| 12 | SS | Scorched Splits |
| 13 | B | Butts |
| 14 | LWP | Large White Pieces |
| 15 | SP | Scorched Pieces |
| 16 | SB | Scorched Butts |
| 17 | SPS | Scorched Pieces Seconds |
| 18 | SWP | Small White Pieces |
| 19 | SSP | Scorched Small Pieces |
| 20 | BB | Baby Butts |
Source: Indian Cashew Nuts Grade Chart
HISTORICAL DEVELOPMENT OF CASHEW SECTOR
1.1 The cashew industry has a long history, dating back to the tropical regions of the Americas, especially the north-east of Brazil. The Tupi people, who were the original inhabitants of that land, knew how to cultivate and consume the cashew called acajú. The cashew trees were part of the Columbian exchange, a process of biological and cultural transfer that occurred after the European exploration of the Americas. The Portuguese and Spanish explorers carried the cashew trees to Asia and Africa around 1500 AD, where they became an important crop. The cashew was recorded by the French, Portuguese and Dutch sailors in the 16th century, who were impressed by its taste. Andre Thevet illustrated cashew in his book Les singularitez de la France Antarctique in 1557, which was one of the first accounts of cashew. In Africa it was first introduced in the east coast in Mozambique and from there it spread to the West Coast. In India, cashew was first introduced in the Malabar Coast by the Portuguese in the 16th century for preventing soil erosion, as per report in the book “The Agronomy & Economy of Important Tree Crops of the Developing World”. From there it spread to other parts of the country as well as to Southeast Asia. The tree adapted well to the climate of Asia and Africa, where it spread naturally and became a common sight in family gardens and wild forests. India was the first to develop the modern cashew processing industry and had a strong position in the global market for a long time.
1.2 The relative position of countries changed significantly during the last five decades. For instance, the countries like Benin and Cote d’Ivoire only began large scale cashew production in the 1990s, but have since recorded higher growth rates. Mozambique was the world’s largest cashew producer in the early 1960s, but production declined significantly in the early 1970s. The United Republic of Tanzania experienced a similar decline in cashew output throughout the 1970s and 1980s but has seen a revival since 2010. Vietnam did not grow cashew on a significant scale before the 1980s, when the Government began to promote the development of the cashew sector. Production in India has followed a path of steady growth since the early 1960s. However, of late, its position started deteriorating as a result of the growing competition from other Countries. Cashew is now grown mainly in Africa, Asia and South America. Africa is the world’s leading producer of Raw Cashew Nut (RCN), accounting for more than half of the global output. The continent has a favorable climate and soil for cashew cultivation. African countries such as Cote d’Ivoire, Tanzania, Burundi, Mozambique, Benin, Guinea- Bissau, Burkina Faso and Ghana are major suppliers of RCN. A growing number of these nations are also foraying in to cashew processing. Asian producers, include India, Cambodia, Vietnam and Indonesia.
TREE NUT PRODUCTION, VALUE AND CONSUMPTION
1.3 Tree nuts include Almonds, Walnuts, Cashews, Pistachios, Hazelnuts, Pecans, Macadamias, Pine Nuts and Brazil Nuts. A remarkable growth of 60.74% has been observed in the global production of tree nuts in the last ten years, reaching 53.75 lakh MT of kernels in 2022-23 from 33.44 lakh MT in 2013 - 14. Cashew kernels, which contributed 18 % of the total kernel output with 6.02 lakh MT in 2013-14, increased its share to 20 % with 10.95 lakh MT in 2022-23. Figure 1.1 displays the quantity of cashew output and world’s tree nut output from 2013-14 to 2022-23.
Figure 1.1: Global Production of Tree Nuts and Cashew Nuts
(Quantity in Lakh MT on Kernel basis)
Source: Statistical Yearbook 2022-23, INC
1.4 The value of tree nuts produced globally increased from 26.84 Bn USD in 2013-14 to 35.86 Bn USD in 2022-23, an increase of 33.61 per cent. Cashew contributed significantly to this growth, as its share increased from 15.46 per cent in 2013-14 to 21.67 per cent in 2022-23. Figure 1.2 shows the trend of cashew supply value from 2013-14 to 2022-23.
Figure 1.2: Global Supply Value of Tree Nuts and Cashew Nuts (Value in Billion USD)
1.5 Among the tree nuts, almonds topped the list in global consumption with 15.71 lakh MT, followed by Walnuts with 9.77 lakh MT and Cashews with 9.65 lakh MT. Figure 1.3 presents the consumption pattern of tree nuts in 2021-22.
Figure 1.3: Share of Different Tree Nuts in Global Consumption of Tree Nuts during 2021-22
Source: Nuts & Dried Fruits Statistical Yearbook 2022-23, INC
1.6 Asia ranks first in tree nut consumption, followed by Europe, North America and Middle East. The region wise consumption of tree nut is illustrated in Figure 1.4.
Figure 1.4: Region wise Consumption Pattern of Tree Nuts during 2021-22
Source: Nuts & Dried Fruit Statistical Yearbook
2022-23, INC
GLOBAL RCN PRODUCTION
1.7 The global production of RCN ranged from 2.90 to 5.63 lakh MT in the 1960s and 1970s, it started to increase in the 1980s and 1990s, reaching 12.18 lakh MT in 1995-96. The production of RCN accelerated in the 2000s and 2010s, reaching 37.06 lakh MT in 2017-18. The production of RCN declined slightly in 2018-19 to 34.84 lakh MT, but recovered in 2019-20 and 2020 - 21 to 36.76 and 41.46 lakh MT respectively. The production of RCN has increased to 50.00 lakh MT in 2022-23. The global production of RCN from 1960-61 to 2022-23 is presented in Figure 1.5.
Figure 1.5: Global Production of Raw Cashew Nuts (RCN) (Quantity in Lakh MT)
Source: Statistical database of Food and Agriculture Organization (FAO) & Statistical Yearbooks published by International Nut & Dried Fruit Council (INC).
1.8 The global production of RCN in the year 2020-21 was dominated by six countries: Cote d’Ivoire (20.5%), India (17.8%), Vietnam (8.4%), Burundi (7.3%) Philippines (6.2%) and Tanzania (5.6%). These countries collectively produced nearly two-thirds of the total RCN output in the world. The productivity of RCN, measured as the yield per hectare, varied significantly among countries. The productivity levels were very high in Philippines, Peru, Mali, Mexico, Sri Lanka and Malaysia, each produced more than 2000 kg of RCN per hectare. Among them, only Philippines and Mali produced a significant volume. The data on the area, production and productivity of RCN in various countries during the year 2020-21 is presented in Table 1.1.
Table 1.1: Global Production of Raw Cashew Nuts (RCN) during 2020-21
| Sl. No. | Country | Area (Ha) | Production (MT) | Productivity (kg/Ha) |
| 1 | Cote d'Ivoire | 2033886 | 848700 | 417 |
| 2 | India | 1158532 | 738009 | 684 |
| 3 | Vietnam | 280886 | 348504 | 1241 |
| 4 | Burundi | 277597 | 300910 | 1084 |
| 5 | Philippines | 29669 | 255915 | 8626 |
| 6 | United Republic of Tanzania | 816225 | 232681 | 285 |
| 7 | Benin | 524250 | 190000 | 362 |
| 8 | Mali | 40583 | 173207 | 4268 |
| 9 | Burkina Faso | 148636 | 162105 | 1091 |
| 10 | Guinea-Bissau | 291365 | 160630 | 551 |
| 11 | Brazil | 426131 | 139921 | 328 |
| 12 | Indonesia | 526022 | 131872 | 251 |
| 13 | Mozambique | 154858 | 128225 | 828 |
| 14 | Nigeria | 142553 | 98809 | 693 |
| 15 | Ghana | 155572 | 82420 | 530 |
| 16 | Sri Lanka | 15621 | 33655 | 2155 |
| 17 | Thailand | 15415 | 24320 | 1578 |
| 18 | Guinea | 11780 | 20856 | 1771 |
| 19 | Malaysia | 7607 | 16148 | 2123 |
| 20 | Kenya | 22690 | 12668 | 558 |
| 21 | Senegal | 21209 | 8750 | 413 |
| 22 | Togo | 5477 | 8111 | 1481 |
| Sl. No. | Country | Area (Ha) | Production (MT) | Productivity (kg/Ha) |
| 23 | Madagascar | 15329 | 7199 | 470 |
| 24 | Colombia | 2379 | 4443 | 1868 |
| 25 | Mexico | 1576 | 4077 | 2587 |
| 26 | Peru | 609 | 3670 | 6026 |
| 27 | Gambia | 1685 | 2767 | 1642 |
| 28 | Honduras | 1444 | 2094 | 1450 |
| 29 | Angola | 2656 | 2033 | 765 |
| 30 | Myanmar | 1711 | 1482 | 866 |
| 31 | El Salvador | 1517 | 936 | 617 |
| 32 | Dominican Republic | 9391 | 658 | 70 |
| 33 | China,mainland | 204 | 230 | 1128 |
| Total | 7145065 | 4146005 | 580 |
Source: CEPCI
GLOBAL CASHEW KERNEL PRODUCTION, EXPORTS, IMPORTS & CONSUMPTION
1.9 Global cashew kernel production has increased significantly in the past decade reaching 10.95 lakh MT in 2022-23 from 6.02 lakh MT in 2013-14. India ranked second with 1.62 lakh MT (14.8%), followed by Cambodia with 1.54 lakh MT (14.1%) and Vietnam with 1.04 lakh MT (9.5%). Brazil and Indonesia contributed 3% and 2% of the global production respectively.
1.10 The global supply value of cashew kernels has increased by 87.23 per cent to 7.77 billion USD in 2022-23 from 4.15 billion USD in 2013-14. This is greater than that of other major tree nuts such as almonds, pistachios, walnuts, and hazelnuts.
1.11 The global cashew kernel exports shows a steady increase from 2011-12 to 2021-22 with only one year (2018-19) showing a slight decline. The export volume showed an overall growth of 6.48 % per annum. The highest export volume was recorded in 2021- 22, with 7.05 lakh MT. Figure 1.6 presents the volume of export of cashew kernels from 2011-12 to 2021-22.
Figure 1.6: Global Export of Cashew Kernels (Qty. in Lakh MT)
Source: Nuts & Dried Fruits Statistical Yearbook 2022-23, INC
1.12 During the year 2021-22, Vietnam was the leading exporter of cashew kernels with nearly two-thirds (65%) of the total volume. Its main customers were USA, European Union, United Kingdom and China. India remains as the second largest exporter of cashew kernel, with just 10 per cent share of the global exports. India’s major export destinations are Asia (UAE, Japan and Saudi Arabia), European Union and the United Kingdom. Netherlands is in the third position with a share of 6 per cent. The other major exporters include Germany, UAE, Brazil and Cote d’Ivoire, each with less than 5% of the total volume. However, Netherlands, Germany and UAE are only transit countries. The major exporters of cashew kernels during 2021-22 are shown in Figure 1.7.
Figure 1.7: Major Exporters of Cashew Kernels during 2021-22 (Qty. in Lakh MT)
Source: Nuts & Dried Fruits Statistical Yearbook 2022-23, INC Note: Netherlands, Germany and UAE are transit countries.
1.13 In 2021-22, USA imported the highest quantity of cashew kernels in the world, with 1.86 lakh MT. This was 0.71 lakh MT more than in 2011-12. Germany and Netherlands followed as the second and third largest importers of cashew kernels. China and UAE were the two major import destinations that reduced their cashew kernel imports since 2011-12. Figure 1.8 shows the
Figure 1.8 Country wise Import of Cashew Kernels (Qty. in Lakh MT)
Source :Nuts & Dried Fruits Statistical Yearbook 2022-23, INC global cashew kernel imports in 2021-22 and the changes from 2011-12.
1.14 The global consumption of cashew kernels has increased significantly in the past five years (Refer Table 1.2). The total consumption rose from 6,49,250 metric tons (MT) in 2017-18 to 7,92,892 MT in 2021-22, an increase of 22.10 per cent. However, the consumption patterns varied across countries, with some showing a remarkable growth and others experiencing a decline.
1.15 India, the largest consumer of cashew kernels in the world, witnessed the most notable increase in consumption. Indian consumption grew from 247,598 MT in 2017-18 to 322,160 MT in 2021-22, an increase of 30.1% over the five year period indicating the increasing popularity of cashew among the Indian consumers.
1.16 The second largest consumer of cashew kernels, the USA, also showed a significant growth in consumption, from 1,50,263 MT in 2017-18 to 1,82,814 MT in 2021-22. The factors that influence the consumption patterns include the availability and price of cashew kernels, competition from other nuts and dry fruits, changing consumer preferences, the trade relations and policies, and the socio-economic and environmental conditions.
Table 1.2: Global Consumption of Cashew Kernels (2017-18 & 2021-22)
| Sl. No. | Countries | 2017-18 (Consumption in MT) | 2021-22 (Consumption in MT) |
| 1 | India | 247598 | 322160 |
| 2 | USA | 150263 | 182814 |
| 3 | Germany | 56949 | 53621 |
| 4 | China | 48357 | 35063 |
| 5 | UK | 19891 | 22589 |
| 6 | France | 12772 | 17321 |
| 7 | Canada | 4579 | 16022 |
| Sl. No. | Countries | 2017-18 (Consumption in MT) | 2021-22 (Consumption in MT) |
| 8 | Australia | 15068 | 15855 |
| 9 | Russia | 7023 | 15623 |
| 10 | Italy | 6459 | 13905 |
| 11 | Japan | 10245 | 13813 |
| 12 | Poland | 6164 | 12813 |
| 13 | Turkey | 4027 | 11552 |
| 14 | Belgium | 6537 | 10744 |
| 15 | Saudi Arabia | 8175 | 9869 |
| 16 | Spain | 5656 | 9720 |
| 17 | Thailand | 7593 | 8747 |
| 18 | Iran | 10833 | 7391 |
| 19 | Brazil | 16914 | 7097 |
| 20 | Israel | 4147 | 6173 |
| Total | 649250 | 792892 |
Source: Nuts & Dried Fruits StatisticalYearbook2022-23, INC
1.17 The per capita consumption of cashew kernels is highest in Belgium, followed by Germany, USA, Italy and Israel during 2021-22. The estimated per capita annual consumption of India, as per INC data, is only 0.16 kg in 2021-22. It may be noted that nine countries have the per capita consumption above one kg per annum. The estimated per capita consumption (kg/year) of cashew kernels during 2021-22 is shown in Figure 1.9.
Figure 1.9: Country wise Per Capita Consumption of Cashew
Kernels in 2021 (Qty. in Kg/Year)
Source: Nuts & Dried Fruits Statistical Yearbook 2022-23, INC
1.20 The State-wise data reveals that Maharashtra has the highest share in RCN production, accounting for 25% of the total production in 2021-22, followed by Andhra Pradesh (17%) and Odisha (16%). While Maharashtra witnessed a steep decline during 2017-18 to
2021-22, production increased in Andhra Pradesh and Odisha.
Kerala is ranked sixth after Tamil Nadu and Karnataka. Kerala
witnessed a decline in production during the period. Figure 1.11 shows the production of RCN in various States of India from
2017-18 to 2021-22.
PRODUCTION AND IMPORTS OF RCN IN INDIA
1.18 Cashew cultivation in India has expanded from 10.41 lakh hectares in 2017-18 to 11.84 lakh hectares in 2021-22, a growth of 13.74 percent. Odisha has the largest area under cashew cultivation with 2.23 lakh hectares, followed by Andhra Pradesh with 1.98 lakh hectares and Maharashtra with 1.91 lakh hectares. Kerala is in the sixth position with an area of 1.07 lakh hectares. Table 1.3 shows the area under cashew cultivation in different States from 2017-18 to 2021-22.
Table 1.3: Area under Cashew Cultivation in India
(in Lakh Hectares)
| Sl. No. | States | 2017-18 | 2018-19 | 2019-20 | 2020-21 | 2021-22 |
| 1 | Odisha | 1.83 | 2.05 | 2.14 | 2.14 | 2.23 |
| 2 | Andhra Pradesh | 1.86 | 1.91 | 1.92 | 1.96 | 1.98 |
| Sl. No. | States | 2017-18 | 2018-19 | 2019-20 | 2020-21 | 2021-22 |
| 3 | Maharashtra | 1.86 | 1.91 | 1.91 | 1.91 | 1.91 |
| 4 | Tamilnadu | 1.42 | 1.46 | 1.5 | 1.67 | 1.73 |
| 5 | Karnataka | 1.28 | 1.3 | 1.32 | 1.37 | 1.38 |
| 6 | Kerala | 0.91 | 0.97 | 0.99 | 1.03 | 1.07 |
| 7 | Goa | 0.58 | 0.58 | 0.58 | 0.59 | 0.59 |
| 8 | Jharkhand | 0.15 | 0.16 | 0.16 | 0.16 | 0.16 |
| 9 | West Bengal | 0.11 | 0.11 | 0.11 | 0.11 | 0.15 |
| 10 | Others | 0.41 | 0.43 | 0.6 | 0.63 | 0.64 |
| Total | 10.41 | 10.89 | 11.24 | 11.59 | 11.84 |
Source: CEPCI
1.19 The RCN production of India during 2017-18 was 8.17 lakh MT, which had declined to 7.16 lakh MT in 2019-20 (Refer Figure 1.10). There after, it increased to 7.52 lakh MT in 2021-22.
Figure 1.10: Production of RCN in India (2017-18 to 2021-22) (Qty. in Lakh MT)
Source: CEPCI
1.20 The State-wise data reveals that Maharashtra has the highest share in RCN production, accounting for 25% of the total production in 2021-22, followed by Andhra Pradesh (17%) and Odisha (16%). While Maharashtra witnessed a steep decline during 2017-18 to 2021-22, production increased in Andhra Pradesh and Odisha. Kerala is ranked sixth after Tamil Nadu and Karnataka. Kerala witnessed a decline in production during the period. Figure 1.11 shows the production of RCN in various States of India from 2017-18 to 2021-22.
Figure 1.11: State wise RCN Production in India (Qty. in Lakh MT)
Source: CEPCI
1.21 The domestic production of RCN is only about 7.50 lakh MT (2021-22), while the estimated processing capacity is 20.00 lakh MT. To increase the domestic production, the Department of Agriculture, Cooperation and Farmers Welfare (DAC&FW) has approved the roadmap programme of Directorate of Cashew nut & Cocoa Development (DCCD) to expand the area of cashew cultivation and replace senile plantations with high yielding varieties. The Cashew Export Promotion Council of India (CEPCI) has also proposed a roadmap to achieve RCN production of 20.00 lakh MT by 2025.
1.22 From 2001-02 to 2020-21, India imported 138.35 lakh MT of RCN for an amount of ` 94,996.54 crore indicating high internal demand for imported RCN. The average value of RCN imported into India during 2021-22 was ` 97.74 per kg. Ivory coast, Tanzania, Guinea Bissau, Benin, Ghana, Mozambique, Nigeria, Senegal, etc. were the major sources of RCN import. The details of RCN import to India from 2001-02 to 2020-21 is provided in Table 1.4.
Table 1.4: Raw Cashew Nut (RCN) Imports to India
| Sl. No. | Year | RCN Imports to India | |
| Quantity (in Lakh MT) | Value (`in Crore) | ||
| 1 | 2001-2002 | 3.56 | 950.00 |
| 2 | 2002-2003 | 4.01 | 1237.00 |
| 3 | 2003-2004 | 4.52 | 1401.00 |
| 4 | 2004-2005 | 5.79 | 2191.00 |
| 5 | 2005-2006 | 5.65 | 2163.00 |
| 6 | 2006-2007 | 5.93 | 1811.62 |
| 7 | 2007-2008 | 6.06 | 1746.80 |
| 8 | 2008-2009 | 6.06 | 2632.41 |
| 9 | 2009-2010 | 7.53 | 3037.09 |
| 10 | 2010-2011 | 5.30 | 2649.00 |
| 11 | 2011-2012 | 8.10 | 5338.64 |
| 12 | 2012-2013 | 8.92 | 5331.74 |
| 13 | 2013-2014 | 7.71 | 4563.99 |
| 14 | 2014-2015 | 9.40 | 6570.93 |
| 15 | 2015-2016 | 9.58 | 8561.01 |
| 16 | 2016-2017 | 7.70 | 8839.42 |
| 17 | 2017-2018 | 6.49 | 8850.03 |
| 18 | 2018-2019 | 8.35 | 10929.00 |
| Sl. No. | Year | RCNImportsto
India |
|
| Quantity (in Lakh MT) | Value (`in Crore) | ||
| 19 | 2019-2020 | 9.38 | 8861.58 |
| 20 | 2020-2021 | 8.31 | 7331.28 |
| Total | 138.35 | 94996.54 | |
Source: DCCD
EXPORT AND IMPORT OF CASHEW KERNELS FROM INDIA
1.23 The export of cashew kernels in 2021-22 is only about half that in 2015-16. The export earnings of cashew kernels also showed a decline, but not as steep as in the quantity of exports. Table 1.5 displays the export of cashew kernels from India in terms of quantity & value for the period of 2002-2022.
Table 1.5: Cashew Kernel Exports from India
| Sl. No. | Year | Cashew Kernel Export | |
| (Quantity in Lakh MT) | Value (` In Crore) | ||
| 1 | 2002-2003 | 1.04 | 1933.00 |
| 2 | 2003-2004 | 1.01 | 1804.00 |
| 3 | 2004-2005 | 1.27 | 2709.00 |
| 4 | 2005-2006 | 1.14 | 2515.00 |
| 5 | 2006-2007 | 1.19 | 2455.15 |
| 6 | 2007-2008 | 1.14 | 2289.02 |
| 7 | 2008-2009 | 1.10 | 2988.40 |
| Sl. No. | Year | CashewKernel
Export |
|
| (Quantity in Lakh MT) | Value (` In Crore) | ||
| 8 | 2009-2010 | 1.18 | 2801.60 |
| 9 | 2010-2011 | 1.06 | 2819.39 |
| 10 | 2011-2012 | 1.32 | 4390.68 |
| 11 | 2012-2013 | 1.00 | 4067.21 |
| 12 | 2013-2014 | 1.15 | 5058.73 |
| 13 | 2014-2015 | 1.19 | 5432.85 |
| 14 | 2015-2016 | 0.96 | 4952.12 |
| 15 | 2016-2017 | 0.82 | 5168.78 |
| 16 | 2017-2018 | 0.85 | 5912.81 |
| 17 | 2018-2019 | 0.67 | 4434.01 |
| 18 | 2019-2020 | 0.68 | 3867.17 |
| 19 | 2020-2021 | 0.50 | 2906.99 |
| 20 | 2021-2022 | 0.54 | 3175.20 |
| Total | 19.80 | 71681.11 | |
Source: DCCD
1.24 The customs duty was brought down to 2.5 % from 5% w.e.f 01.02.2018. Further, the Union government allowed duty free import of RCN from Least Developed Countries (LDCs) under Duty Free Tariff Preference (DFTP) Scheme.
1.25 India exported cashew kernels to several countries, including European, Asian, Middle Eastern, North American and African countries. In 2021-22, the exports was highest to United Arab Emirates (U.A.E) with a share of 31 % in both quantity and value. The second and third largest importers of Indian cashew kernels were Netherlands and Japan, respectively. The top three countries together constituted more than fifty per cent of the total exports. Saudi Arabia and the United States of America (U.S.A) were also significant importers of the Indian cashew kernels. Some of the other notable importers were Spain, Germany, Malaysia, Singapore, Kuwait, Iran and Canada.
1.26 India’s export destinations have changed significantly over the years. The UAE was the top importer of Indian cashew kernels in both 2017-18 and 2021-22, but the exports decreased by 21.63 % in value terms. The Netherlands, Japan, Saudi Arabia and the U.S.A were the other major importers of Indian cashew kernels in 2017-18, but their ranks and shares declined considerably in 2021-22. The U.S.A, for instance, slipped from the second position to the sixth position. On the other hand, some countries increased their imports of Indian cashew kernels over the years. Germany, for example, rose from the fifteenth position to the eighth position. Iran also emerged as a significant importer of Indian cashew kernels, jumping from the twenty-sixth position to the sixteenth position. The country wise export of cashew kernels from India is shown in Table 1.6.
Table 1.6: Country wise Cashew Kernel Exports from India (2017-18 & 2021-22)
| Sl. No. | Countries | 2017-18 | 2021-2022 | ||
| QTY (MT) | VALUE
(`InCrore) |
QTY (MT) | VALUE
(` In Crore) |
||
| 1 | U.A.E | 17570.00 | 1252.29 | 16575.20 | 981.46 |
| 2 | Netherlands | 8650.00 | 584.05 | 5511.90 | 305.91 |
| 3 | Japan | 8509.00 | 596.85 | 5683.54 | 431.21 |
| 4 | Saudi Arabia | 7827.00 | 552.36 | 4769.83 | 286.92 |
| 5 | U.S.A | 13179.00 | 906.14 | 2791.54 | 163.78 |
| 6 | Belgium | 2534.00 | 182.16 | 374.37 | 20.56 |
| 7 | Spain | 3278.00 | 229.44 | 2425.45 | 160.25 |
| 8 | Kuwait | 2067.00 | 150.58 | 1829.82 | 109.22 |
| 9 | Germany | 1153.00 | 82.82 | 1877.36 | 119.16 |
| 10 | France | 2135.00 | 154.33 | 118.23 | 5.75 |
| 11 | Qatar | 1268.00 | 88.95 | 1329.67 | 79.45 |
| 12 | U.K | 1129.00 | 77.70 | 539.82 | 32.30 |
| 13 | Greece | 1978.00 | 136.17 | 712.66 | 43.92 |
| 14 | Singapore | 1825.00 | 124.93 | 926.62 | 57.54 |
| 15 | Korea Rep. | 603.00 | 41.77 | 219.47 | 14.22 |
| 16 | Malaysia | 613.00 | 41.83 | 1012.84 | 58.80 |
| 17 | Bahrain | 442.00 | 31.75 | 721.73 | 43.12 |
| 18 | Trinidad | 1541.00 | 108.41 | 127.01 | 6.94 |
| 19 | Turkey | 531.00 | 34.20 | 62.65 | 3.23 |
| 20 | Canada | 677.00 | 42.65 | 100.41 | 3.48 |
| 21 | Israel | 861.00 | 53.29 | 90.98 | 6.06 |
| 22 | Italy | 383.00 | 20.79 | 109.84 | 5.73 |
| 23 | Jordan | 461.00 | 33.58 | 12.10 | 1.12 |
| 24 | Iran | 60.00 | 3.56 | 522.00 | 29.77 |
| 25 | Algeria | 267.00 | 19.62 | 30.00 | 1.62 |
| 26 | Others | 5424.00 | 362.59 | 5294.84 | 203.68 |
| Total | 84965.00 | 5912.81 | 53769.88 | 3175.20 | |
Source: CEPCI
1.27 The export of salted and roasted cashew kernels from India, which forms less than 5 per cent of the total cashew kernel exports, has decreased by 11.21 % and 3.30 % in quantity and value terms respectively between 2017-18 and 2021-22. The details are shown in Table 1.7.
Table 1.7: Export of Salted & Roasted Cashew Kernels (2017-18 & 2021-22)
| Sl. No. | Year | ExportofSalted&RoastedCashewKernels | |
| MT | (`in Crore) | ||
| 1 | 2017-18 | 2872 | 182.73 |
| 2 | 2018-19 | 1473 | 106.82 |
| 3 | 2019-20 | 2128 | 149.51 |
| 4 | 2020-21 | 2035 | 138.29 |
| 5 | 2021-22 | 2550 | 176.7 |
| Total | 11058 | 754.05 | |
Source: CEPCI
1.28 Even though the total import volume of cashew kernels showed a decline during the five years ending 2021-22, the import of whole kernels showed an increase despite the interventions discussed above. However, the import of broken nuts and other categories declined sharply in 2020-21 and 2021-22. Wholes constituted as high as 88% of the total kernel imports to India in terms of quantity and 94% in terms of value in 2021- 22. The value of imports ranged between ` 160 crores and ` 285 crores during the five year period ending 2021-22. Table 1.8 shows the import data from 2017-18 to 2021-22.
Table 1.8: Cashew Kernel Imports to India from 2017-18 to 2021-22
Source: CEPCI
EXPORT OF CNSL & CARDANOL FROM INDIA
1.29 India also exports a limited quantity of CNSL and Cardanol.
The total value of exports was only ` 32.5 crores in 2021-22. It is also observed that the quantity of exports witnessed a decline after 2015-16. More than half of the Indian exports was to three countries viz., Republic of Korea (28%), Belgium (19%) and Spain (6%). The export of CNSL and Cardanol from India from 2002 - 03 to 2021-22 is given in Table 1.9.
Table 1.9: Cashew Nut Shell Liquid & Cardanol
| Sl. No. | Year | CNSL&Cardanol ExportsfromIndia | |
| Quantity (in MT) | Value (` In Crore) | ||
| 1 | 2002-2003 | 7215 | 9.26 |
| 2 | 2003-2004 | 6926 | 7.03 |
| 3 | 2004-2005 | 7474 | 7.91 |
| 4 | 2005-2006 | 6405 | 7.09 |
| Sl. No. | Year | CNSL & Cardanol Exports from India | |
| Quantity (in MT) | Value (` In Crore) | ||
| 5 | 2006-2007 | 6139 | 10.29 |
| 6 | 2007-2008 | 7813 | 11.98 |
| 7 | 2008-2009 | 9099 | 26.06 |
| 8 | 2009-2010 | 11227 | 27.62 |
| 9 | 2010-2011 | 12051 | 33.77 |
| 10 | 2011-2012 | 13575 | 59.46 |
| 11 | 2012-2013 | 9192 | 29.84 |
| 12 | 2013-2014 | 9480 | 38.61 |
| 13 | 2014-2015 | 10938 | 55.81 |
| 14 | 2015-2016 | 11677 | 57.59 |
| 15 | 2016-2017 | 11422 | 44.00 |
| 16 | 2017-2018 | 8325 | 32.63 |
| 17 | 2018-2019 | 5300 | 26.85 |
| 18 | 2019-2020 | 4605 | 23.09 |
| 19 | 2020-2021 | 3735 | 19.72 |
| 20 | 2021-2022 | 4944 | 32.50 |
| Total | 167542 | 561.11 | |
Source: DCCD & CEPCI
OTHER CASHEW PRODUCTS
1.30 Other cashew products include Shell Cake, Testa, Cashew Apple and Gum. The de-oiled cashew shell or cashew shell cake, is a by- product of extracting CNSL. It can be carbonized and combined with a binder to form briquettes that can be used as fuel for industrial boilers. It can also be processed into vermiculite, a product that is useful for gardening and hydroponics. The thin skin covering the kernel called testa has high tannin content and
is used as a raw material for tanning agent in the leather industry. Cashew apple, a rich source of vitamin C and antioxidants, is made into pectin and juices, as well as alcoholic drinks, vinegars, syrups and jams. The fibrous waste from juicing cashew apple is used as an animal feed or as a carotenoid-rich ingredient for food supplements or natural food colours. Cashew apple juice is produced in Brazil, Senegal and Vietnam, and in Ghana, where cashew apple brandy is another popular product. Cashew gum that comes out of the cashew tree’s bark, has many uses in the food industry and pharmaceuticals. However, there has been only limited success in making these products in India.
INDIAN STANDARDS OF GRADING
1.31 Cashew kernels are graded in India based on their colour, shape and size. There are 20 grades of cashew kernels in India. White kernels and Scorched kernels are the two-colour categories. Wholes, Splits, Butts and Pieces are the four shape categories. The Wholes have five size categories: 180, 210, 240, 320 and 450. The Splits, Butts and Pieces have three size categories: large, small and baby. Table 1.10 shows the grading system used by India for cashew kernels.
Table 1.10: Indian Grading System
| Sl.No. | Grade | Description |
| 1 | WW-180 | White Wholes 180 |
| 2 | SW-180 | Scorched Wholes 180 |
| 3 | WW-210 | White Wholes 210 |
| 4 | WW-240 | White Wholes 240 |
| 5 | SW-240 | Scorched Wholes 240 |
| 6 | SW-210 | Scorched Wholes 210 |
| 5 | WW-320 | White Wholes 320 |
| Sl.No. | Grade | Description |
| 6 | WW-450 | White Wholes 450 |
| 7 | SW-450 | Scorched Wholes 450 |
| 8 | SW-320 | Scorched Wholes 320 |
| 9 | S | Splits |
| 10 | SW | Scorched Wholes |
| 11 | SSW | Scorched Wholes Second |
| 12 | SS | Scorched Splits |
| 13 | B | Butts |
| 14 | LWP | Large White Pieces |
| 15 | SP | Scorched Pieces |
| 16 | SB | Scorched Butts |
| 17 | SPS | Scorched Pieces Seconds |
| 18 | SWP | Small White Pieces |
| 19 | SSP | Scorched Small Pieces |
| 20 | BB | Baby Butts |
Source: Indian Cashew Nuts Grade Chart